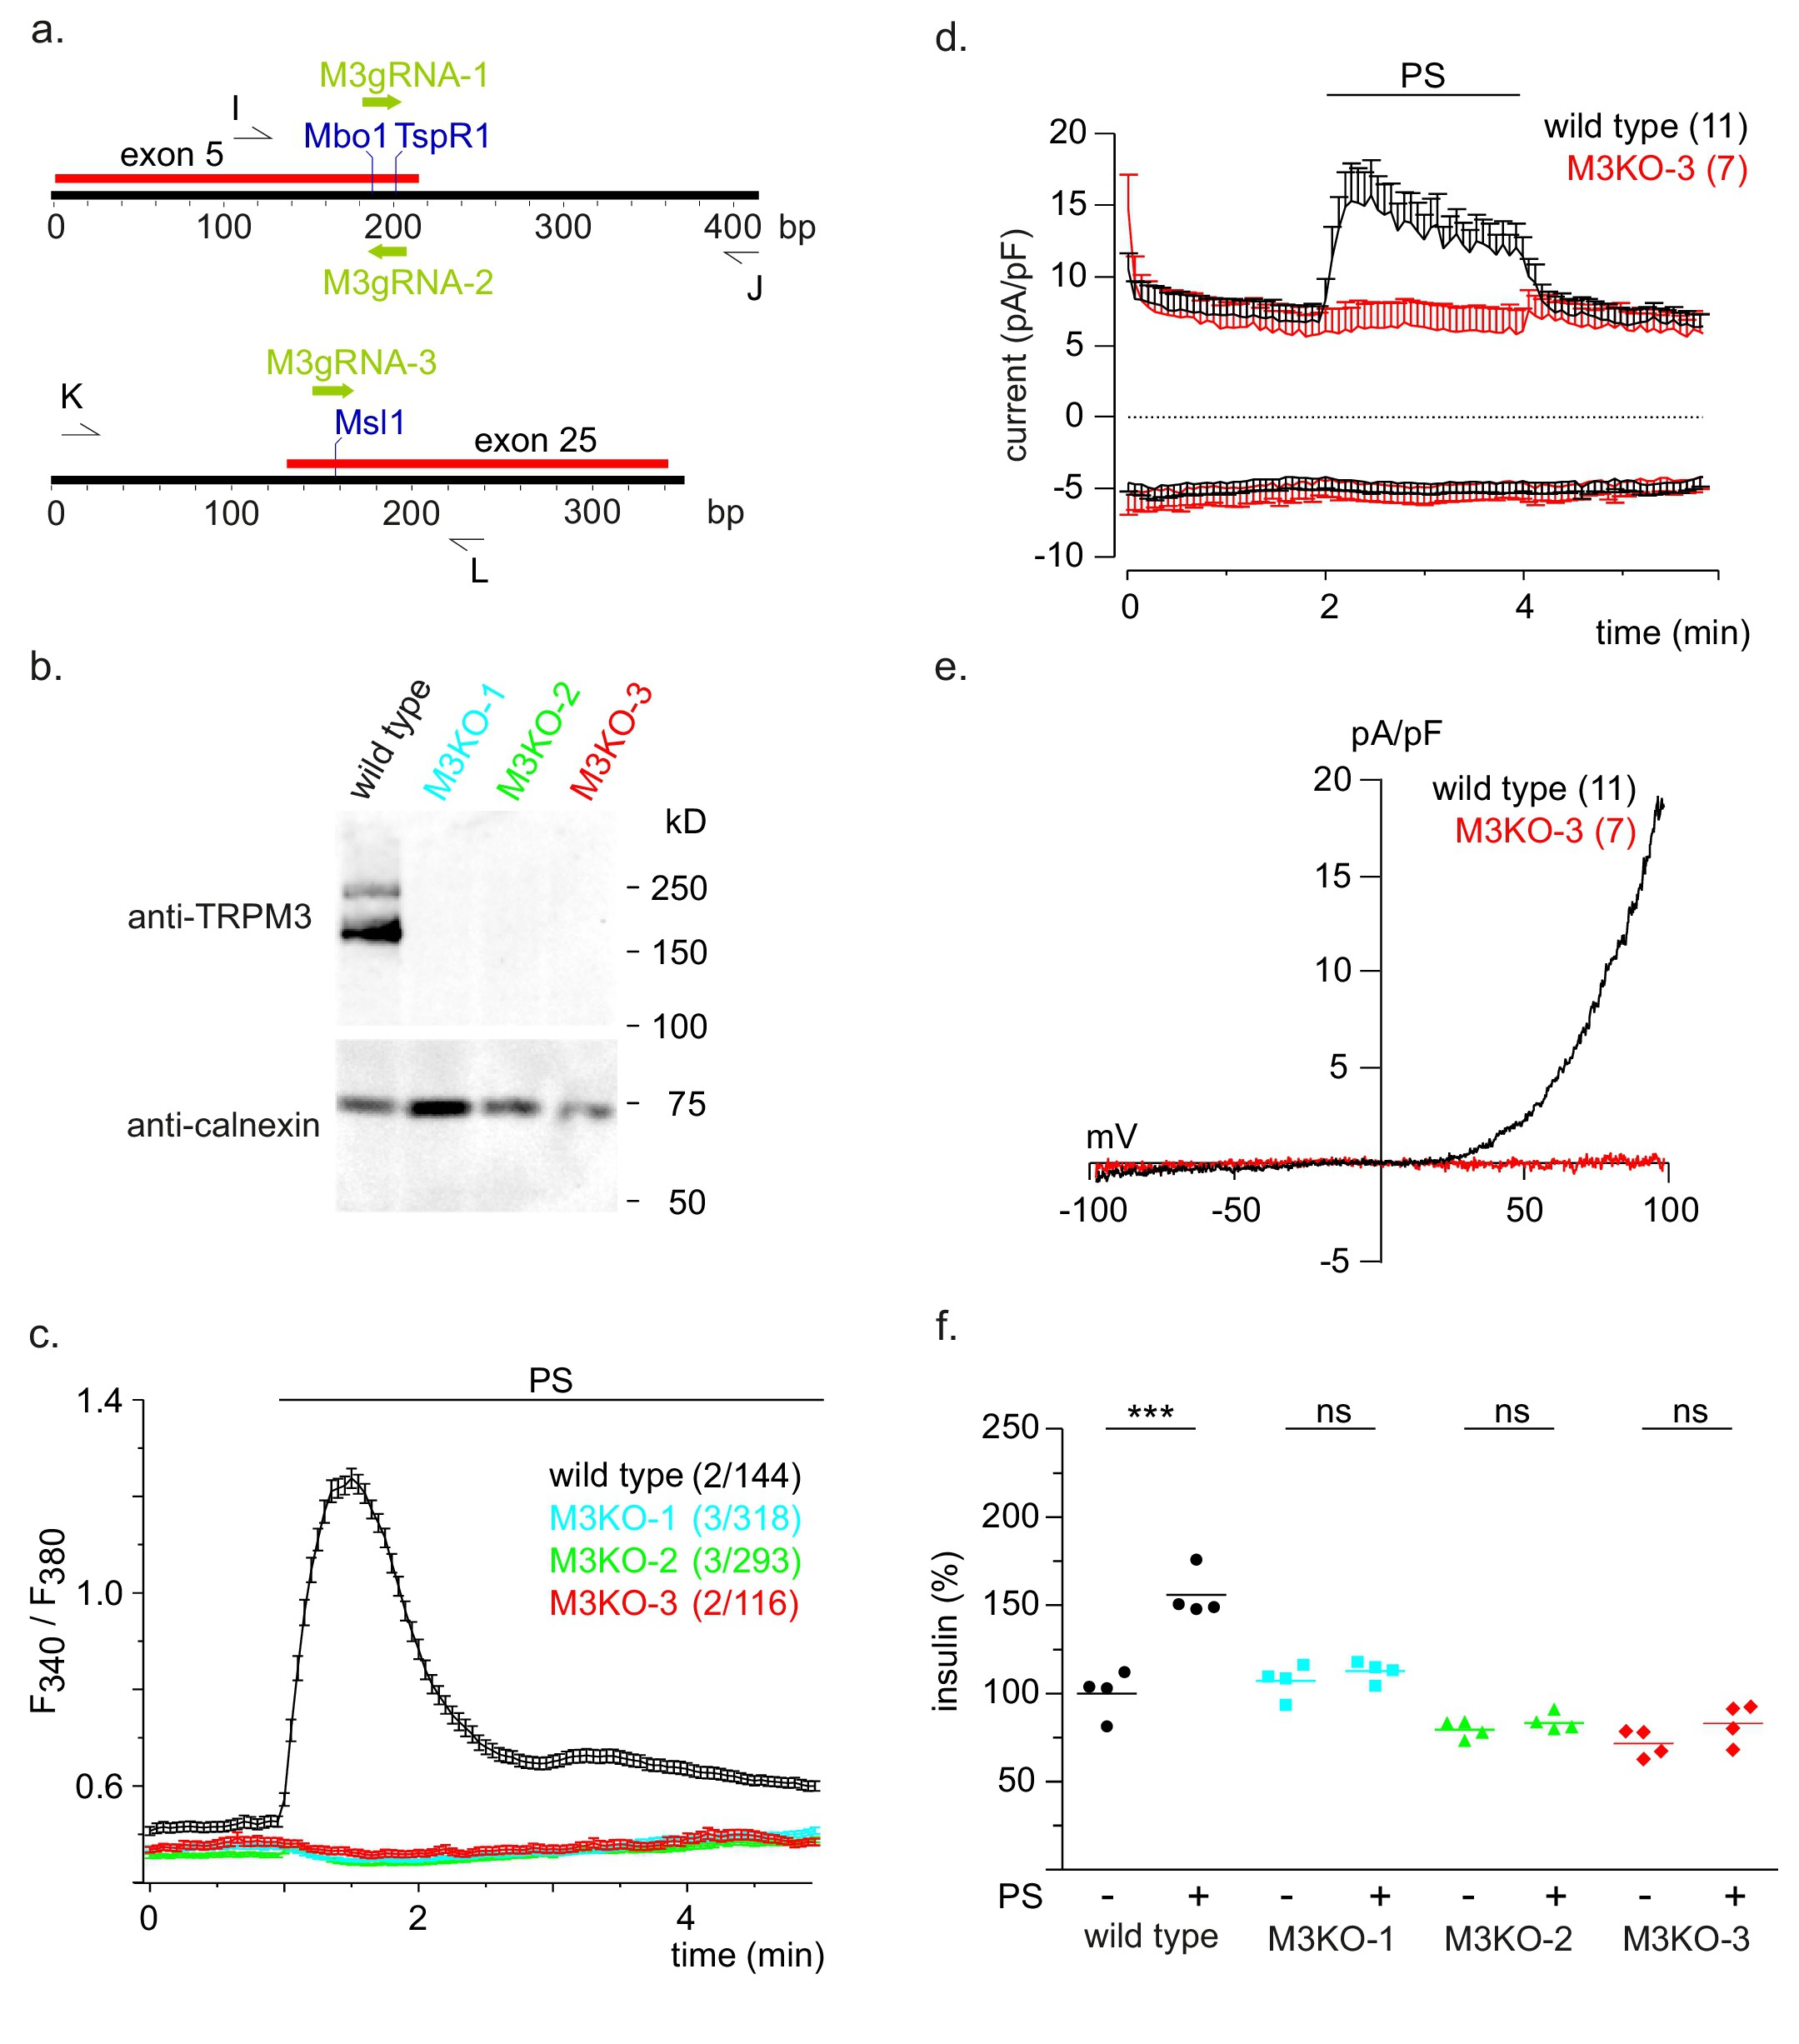
Fig. 3. Absence of PS-induced [Ca2+]cyt elevations, ionic currents, and insulin release in TRPM3-deficient INS-1 cells. (a) CRISPR/Cas9-based strategy for the deletion of the Trpm3 gene. The locations of the target sequences for the guide RNAs M3gRNA-1, M3gRNA-2, and M3gRNA-3, of the restriction enzymes Mbo1, TspR1, and Msl1 to analyse introduced mutations and of the oligonucleotide primers I, J, K, and L to amplify genomic sequences are indicated. (b) Absence of TRPM3 in the mutant INS-1 cell clones M3KO-1, M3KO-2, and M3KO-3. TRPM3 proteins from wild-type as well as from mutant INS-1 cells were precipitated using polyclonal anti-TRPM3 antibodies and detected on a western blot (upper panel) with monoclonal anti-TRPM3 antibodies. A western blot of non-precipitated proteins (lower panel) was incubated with anti-calnexin antibodies to detect calnexin as loading control. (c) Fura-2 fluorescence ratios observed in wild-type and mutant INS-1 cell clones before and after addition of 100 µM PS. Traces represent mean values (± SEM) with the numbers of experiments/cells indicated in brackets. (d) Whole-cell in- and outward currents normalized to the cell size (pA/pF) at -80 and 80 mV, respectively, were extracted from voltage ramps (0.5 Hz) spanning from -100 to 100 mV within 400 ms (Vh 0 mV) and plotted versus time in wild-type cells (black) and the TRPM3-deficient M3KO-3 clone (red) in the presence or absence of 100 µM PS. Experiments were performed in the presence of 10 µM verapamil to block L-type Ca2+ channels. Data represent means (+ S.E.M.) of the cell number indicated in brackets. (e) Current-voltage relationships (IVs) of the mean maximum net currents (Imaxnet) shown in d during the application of PS. (f) Insulin released from wild-type INS-1 cells and Trpm3 knockout INS-1 cell clones M3KO-1, M3KO-2, and M3KO-3 in the absence (-) or presence (+) of 100 µM PS. Values were normalized to the mean level obtained in wild-type cells without PS.